
|
|
PERFECT COMPETITION AND DEMAND: The demand curve for the output produced by a perfectly competitive firm is perfectly elastic at the going market price. The firm can sell all of the output that it wants at this price because it is a relatively small part of the market. As a price taker, the firm has no ability to charge a higher price and no reason to charge a lower one. The market price facing a perfectly competitive firm is also the firm's average revenue and, most importantly, its marginal revenue.
Visit the GLOSS*arama
|
|


|

|
                           DERIVATION, CONSUMPTION LINE: A consumption line, a graphical depiction of the relation between household sector consumption and income, can be derived from a simple consumption schedule, a table or chart showing the relation between household sector consumption and income. This is easily accomplished by plotting the consumption-income pairs from the schedule as points in a diagram that measures consumption on the vertical axis and income on the horizontal axis, then connection the points with a line. The consumption line can also be derived directly by plotting the consumption function using slope and intercept values. The consumption line, also termed propensity-to-consume line or consumption function, can be derived by plotting the consumption-income combinations from a consumption schedule into a graph. It can also be derived by plotting the mathematical specification of a consumption function using slope and intercept.| Consumption Schedule | 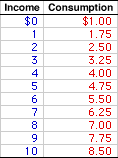 | | | Consumption Line | 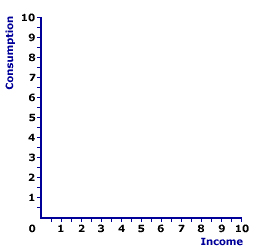
|
First up is the consumption schedule. A representative consumption schedule is presented in the upper panel of the exhibit to the right. The two columns in the table measure income and consumption in trillions of dollars.The first column of this table presents total income of the household sector. These values conveniently range from $0 to $10 trillion. The second column then presents the amount of this income the household sector uses for consumption expenditures. These values range from $1 trillion to $8.5 trillion. The derivation of the consumption line involves plotting the consumption-income pairs in the schedule into a diagram, such as the space presented in the bottom panel of the exhibit. This currently blank space measures consumption on the vertical axis and income on the horizontal axis. The consumption-income pairs from the top panel can be plotted in the bottom panel by clicking the [Consumption Line] button. Once all points are plotted, the result is the red consumption line labeled C. The two features of the consumption line are slope and intercept. - Slope: The slope is positive, but less than one. In fact, the slope of the consumption line is numerically equal to the marginal propensity to consume (MPC). In this case the slope is equal to 0.75. The positive slope reflects induced consumption expenditures--more income means more consumption. Click the [Slope] button to illustrate.
- Intercept: The consumption line intersects the vertical axis at a value of $1 trillion. This intersection point is autonomous consumption--consumption expenditures unrelated to income. Click the [Intercept] button to illustrate.
The consumption line can also be plotted directly using the consumption function. The two key bits of information needed for this task are the intercept and the slope. The following linear consumption function can be used to illustrate.where: C is consumption expenditures, Y is income (national or disposable), a is the intercept, and b is the slope.The consumption line can be constructed by simply drawing a line with slope b that emerges for the vertical axis at intercept a.
Recommended Citation:DERIVATION, CONSUMPTION LINE, AmosWEB Encyclonomic WEB*pedia, http://www.AmosWEB.com, AmosWEB LLC, 2000-2024. [Accessed: May 2, 2024].
Check Out These Related Terms... | | | | | | | | | | | | | |
Or For A Little Background... | | | | | | | |
And For Further Study... | | | | | | | | | | | | | | |
Search Again?
Back to the WEB*pedia
|

|

|
PINK FADFLY
[What's This?]
Today, you are likely to spend a great deal of time at the confiscated property police auction hoping to buy either a handcrafted bird house or a weathervane with a chicken on top. Be on the lookout for bottles of barbeque sauce that act TOO innocent.
Your Complete Scope
This isn't me! What am I?
|

|
|
Lombard Street is London's equivalent of New York's Wall Street.
|

|
|
"Leadership is based on inspiration, not domination; on cooperation, not intimidation. " -- William A. Ward
|

|
NLREG
Nonlinear Statistical Regression
|

|
|
Tell us what you think about AmosWEB. Like what you see? Have suggestions for improvements? Let us know. Click the User Feedback link.
User Feedback
|

|

